



Everything Is a Chokepoint: Hormuz, Helium, Gold and the Architecture of Monetary Escape
The Strait of Hormuz has become more than an oil story. It is revealing how energy, AI, agriculture, military power, financial markets and money itself depend on narrow corridors—and why the next great monetary contest may be over who controls them, who can be excluded from them, and who can route around them.
By k1ngVV · August 23rd, 2026
Executive Summary
The crisis in the Strait of Hormuz has exposed a structural weakness far larger than the energy market. In the fourth quarter of 2025, an estimated 21.6 million barrels per day of crude oil and petroleum liquids moved through the Strait. By the second quarter of 2026, that flow had fallen to approximately 4.9 million barrels per day.[1][2] The disruption did not remain inside the oil market. It propagated into LNG, industrial gases, fertilizer, food production, shipping insurance, strategic reserves and financial markets.
The deeper lesson is that the global economy is not a smooth, borderless network. It is a stack of chokepoints. Some are geographic, like Hormuz. Others are industrial, such as helium production, semiconductor fabrication and ammonia plants. Others are commercial, where insurers, shipowners and banks determine whether a route is economically usable. Still others are financial and monetary: correspondent banks, clearing systems, stablecoin issuers, central banks, identity systems and public ledgers.
This article develops two frameworks for understanding that world: the Chokepoint Stack, which maps how concentrated dependencies become instruments of leverage, and the Monetary Chokepoint Test, which asks where control, observation and exclusion reside inside different forms of money. Gold, fiat currencies, stablecoins, CBDCs, Bitcoin and privacy coins solve different parts of the problem. None eliminate dependency altogether.
For privacy coins, the implication is especially important. Privacy cannot be judged at the transaction layer alone. A monetary system can conceal amounts while exposing IP addresses, decentralize issuance while centralizing infrastructure, or remove a corporate issuer while leaving every economic relationship visible on a permanent public ledger. Ryo Currency is relevant to this discussion because its current privacy architecture and longer-term roadmap attempt to reduce chokepoints across several layers. But its planned Halo 2 system, high-latency mixnet, Proof-of-Stake transition and governance architecture must be evaluated as engineering objectives until they are implemented, reviewed, tested and deployed. The question is not whether Ryo has eliminated every chokepoint. It has not. The question is whether digital money can be deliberately designed so that fewer participants occupy privileged positions from which they can observe, discriminate or deny.
Conceptual continuity: This analysis extends the framework developed across
Cyberwarfare, Financial Infrastructure, and the Rise of Neutral Money,
The Post-Fiat Renaissance,
The Yuan Ultimatum,
The End of Free-Floating Fiat,
The Human Chokepoint,
When Institutions Fail,
God, State, and Network,
From Network Union to Network State,
Private From Washington, Visible to Beijing,
and
The Bitcoin Magnet.
It also incorporates the more recent technical framework developed in
ProxyMark and Monero over Tor
and
The End of the Ring.
Twenty-one-point-six million barrels a day.
Then 4.9.
Those two numbers tell the story more clearly than most geopolitical commentary.
For decades, the Strait of Hormuz was described as a potential vulnerability: a narrow maritime corridor between Iran and Oman through which an extraordinary share of the world’s energy supply happened to pass. Analysts drew arrows on maps. War colleges modelled closure scenarios. Energy ministries maintained emergency reserves. Naval planners rehearsed keeping the waterway open.
Then the hypothetical became measurable.
By the second quarter of 2026, estimated petroleum flows through Hormuz had collapsed to less than one-quarter of their late-2025 level.[2]
But oil was only the first layer.
The real discovery of 2026 is that the modern global economy contains far more straits than the one visible on a map.
Featured in the Ryo Directory
Businesses accepting RYO
I. The Strait That Runs Through Everything
According to the International Energy Agency, around 20 million barrels per day of crude oil and petroleum products moved through the Strait of Hormuz in 2025, equivalent to roughly one-quarter of global seaborne oil trade. Around 80% of those flows were destined for Asian markets.[1]
The vulnerability is not simply the volume. It is the asymmetry between what normally passes through the Strait and what can bypass it.
Saudi Arabia and the United Arab Emirates possess pipelines capable of diverting some production away from Hormuz. The IEA estimates practical bypass capacity at roughly 3.5 to 5.5 million barrels per day.[1] That is meaningful redundancy. It is not a replacement for a corridor carrying around 20 million barrels per day in normal conditions.
LNG presents an even harder problem. Qatar routes nearly all of its LNG exports through Hormuz. The IEA estimates that LNG passing through the Strait represented around 19% of global LNG trade in 2025, with no equivalent alternative maritime route for those volumes.[1]
Chart 1. The Strait Didn’t Close on a Map. It Closed in the Data.
Estimated crude oil and petroleum liquids transported through the Strait of Hormuz, million barrels per day.
Source: ryo.news visualization using U.S. Energy Information Administration estimates based on tanker-tracking data.[2]
The scale of the break is easier to understand visually. Between the fourth quarter of 2025 and the second quarter of 2026, estimated Hormuz petroleum flows fell by roughly 77%. That is not a marginal disruption to a flexible market. It is an abrupt reduction in the use of one of the largest energy corridors on Earth.
Nor can a pipeline simply recreate a missing strait. Even at the upper end of the IEA’s estimated bypass range, alternative Saudi and Emirati crude routes amount to only a fraction of normal Hormuz oil flows. The map below shows why geography remains stubbornly relevant even in a financial system capable of transmitting trillions of dollars electronically in seconds.
Chart 2. Bypass Capacity Is Not a Substitute for Hormuz
Existing Saudi and UAE crude pipelines can redirect some Gulf exports, but their available capacity is much smaller than normal flows through the Strait.

Source: International Energy Agency. IEA graphic licensed CC BY 4.0.[1]
The asymmetry becomes even sharper in natural gas. Oil can sometimes be redirected, blended, released from storage or replaced by another producer. LNG is constrained by liquefaction plants, specialized terminals, long-term contracts and purpose-built carriers. Qatar cannot simply move an LNG train to the opposite coast because one maritime corridor becomes dangerous.
Chart 3. The LNG Chokepoint
Selected measures of LNG dependence on the Strait of Hormuz in 2025.
Source: ryo.news visualization using International Energy Agency data.[1]
The geopolitical burden is therefore highly uneven. Almost 90% of LNG shipped through Hormuz in 2025 went to Asia. Bangladesh, India and Pakistan obtained roughly two-thirds of their LNG supplies through the Strait, while Qatar and the UAE had no equivalent route capable of moving those export volumes into the global market.[1]
This is the first principle of the chokepoint economy:
Scarcity is not always a shortage of things. Sometimes it is a shortage of routes.
A country can possess oil underground and still be unable to deliver it where it is needed. A refinery can possess crude and still lack the particular feedstock, component or shipping access required to operate efficiently. A buyer can possess dollars and still be unable to obtain the cargo at an acceptable insurance cost.
The physical resource is only one part of the system.
II. The Chokepoint Stack
The usual way to analyse a crisis is sector by sector. Oil analysts discuss barrels. Military analysts discuss missiles. Shipping analysts discuss vessels. Economists discuss inflation. Monetary analysts discuss rates and reserves.
That division obscures what connects them.
A chokepoint is any narrow dependency through which a disproportionate amount of economic or political activity must pass. Once that dependency becomes difficult to substitute, whoever can influence it gains leverage.
| Layer | Chokepoint | What becomes scarce |
|---|---|---|
| 1. Physical | Straits, ports, pipelines, canals | Routes |
| 2. Resource | Oil, LNG, helium, critical minerals | Inputs |
| 3. Industrial | Refineries, fabs, ammonia plants | Processing capacity |
| 4. Military | Missiles, interceptors, bases, naval access | Security |
| 5. Commercial | Insurers, shipowners, banks, cargo finance | Risk tolerance |
| 6. Strategic | Reserves, inventories, bypass infrastructure | Time |
| 7. Financial | Correspondent banks, clearing, sanctions infrastructure | Access |
| 8. Monetary | Issuers, administrators, identity and policy layers | Permission |
| 9. Network | Ledgers, relays, validators, exchanges, governance | Privacy and autonomy |
The table provides the taxonomy. The more important question is how the layers interact.
Read the stack from the top down and it becomes a model of shock propagation. A physical route becomes dangerous. Energy or raw materials become harder to move. Industrial facilities lose inputs. Commercial actors reduce their willingness to take risk. Governments consume strategic reserves. Financial conditions tighten. Policymakers face fewer attractive options.
Read the same stack from the bottom up and it becomes a model of political leverage. The less substitutable a dependency becomes, the more power accumulates around whoever can observe it, restrict it, insure it, authorize it or deny access to it.
Leverage rises as substitutability falls.
That principle is what unites a maritime strait with an ammonia plant, an interceptor stockpile, a correspondent bank and a public blockchain.
The objects are different.
The political geometry is the same.
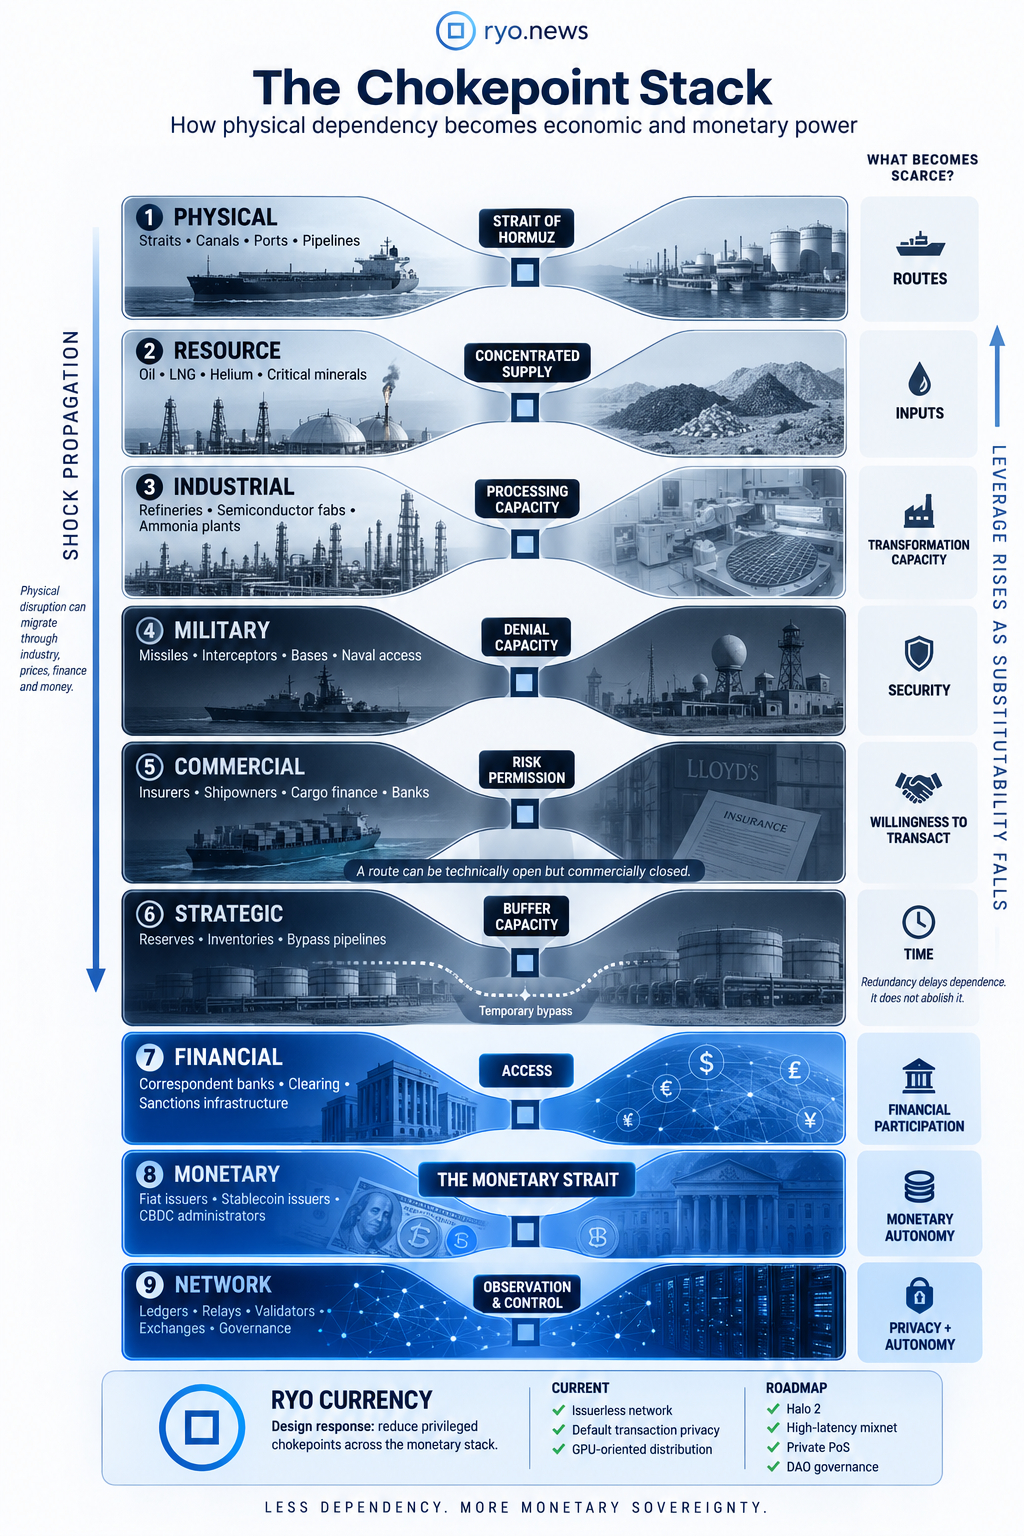
Chart 12. The Chokepoint Stack. Modern economic systems contain layers of concentrated dependency. Physical disruption can propagate into industrial, commercial, financial and monetary systems, while strategic leverage increases where substitution becomes difficult. Privacy-oriented digital money attempts to reduce privileged chokepoints at the issuer, ledger, network and governance layers. Source: ryo.news conceptual framework based on IEA, EIA, IMO, IMF, BIS and the technical literature cited in this article.
The distinction between the upper and lower layers is especially important.
The first layers are easy to recognize because their constraints are physical. A tanker cannot cross a minefield by software update. A semiconductor fab cannot replace helium with a governance vote. An ammonia plant cannot produce fertilizer from a spreadsheet. These chokepoints are visible because they occupy territory, consume energy and move physical matter.
The lower layers are more deceptive.
A correspondent-banking relationship does not appear on a geopolitical map. Neither does a stablecoin blacklist function, a validator concentration, an exchange delisting decision or a network observer correlating transaction broadcasts with IP addresses.
Yet each can become a point at which economic participation narrows.
That is the central symmetry of the stack:
Physical systems concentrate power through scarcity of routes.
Financial systems concentrate power through scarcity of access.
Digital monetary systems can concentrate power through scarcity of permission, privacy or credible alternatives.
The strategic layer deserves special attention because it reveals the role of redundancy. Reserves, inventories and bypass routes do not remove a chokepoint. They allow a system to survive it temporarily.
A strategic petroleum reserve converts stored oil into time.
A second pipeline converts infrastructure into routing flexibility.
An alternative bank converts institutional diversity into financial resilience.
A decentralized relay network converts infrastructure diversity into censorship resistance.
In every case, redundancy matters because dependency that has only one route can become control.
Redundancy delays dependence. Decentralization attempts to prevent dependence from becoming a permanent privilege.
This is why the final three layers of the stack—financial, monetary and network—cannot be dismissed as an unrelated cryptocurrency detour.
They are the digital continuation of the same geopolitical problem.
Hormuz makes the architecture visible because ships physically queue outside it.
A monetary chokepoint can remain invisible until a transfer is rejected, an account is frozen, an address is blacklisted, a currency becomes unusable outside one jurisdiction, or a supposedly private transaction is linked back to its origin through metadata.
Digitization does not eliminate the political logic of geography.
It recreates that logic in software.
The rest of the article follows the stack downward: first through industrial inputs, strategic power and financial vulnerability, then into the monetary and network layers where control becomes less visible but no less consequential.
III. The Cloud Is Built on Atoms
Mike Maloney’s recent analysis of the Iran crisis is most useful not as a price forecast but as a dependency map.[41]
Its most interesting contribution is not oil.
It is helium.
According to the U.S. Geological Survey, world helium production in 2025 was approximately 190 million cubic metres. Qatar produced about 63 million cubic metres—roughly one-third of the global total. Russia produced about 18 million, Algeria 11 million, Canada 6 million, and China and Poland around 3 million each.[8]
Chart 4. The Invisible Gas Beneath the Digital Economy
Selected non-U.S. helium production in 2025, million cubic metres.
Source: ryo.news visualization using U.S. Geological Survey, Mineral Commodity Summaries 2026.[8]
Helium is easy to ignore because it does not appear on a consumer’s electricity bill. But it occupies critical niches in cryogenics, scientific equipment, medical imaging, aerospace and semiconductor production. USGS notes that for cryogenic applications requiring extremely low temperatures, there is no straightforward substitute.[8]
The U.S. figures reinforce the connection to the digital economy. USGS estimates that controlled atmospheres, fibre optics and semiconductors accounted for 17% of U.S. helium use in 2025, while analytical, engineering and scientific applications represented another 22%. Helium is therefore not merely a party-balloon commodity. It is part of the physical support structure behind advanced industrial civilization.[8]
This exposes one of the central illusions of the digital age.
We call it the cloud because the word makes computation sound weightless.
It is not.
Artificial intelligence depends on data centres. Data centres depend on semiconductors. Semiconductor fabrication depends on specialized machinery, chemicals, gases, water and electricity. Electricity depends on generation and grids. Hardware depends on copper, transformers and logistics. All of it eventually touches geography.
The artificial-intelligence revolution cannot transcend the periodic table.
This adds a missing physical layer to the argument developed in Autonomous AI Agents Need Private Money. Autonomous machine economies may eventually require native digital settlement. But the machines themselves remain embedded in a brutally physical economy of chips, cooling, energy, metals and industrial gases.
An AI agent may transact at machine speed.
The fab producing its accelerators still waits for atoms.
IV. From Gas to Grain
The next dependency chain is even more consequential.
Natural gas is not only fuel. It is feedstock.
Modern fertilizer production depends heavily on hydrogen derived from natural gas. Hydrogen feeds ammonia production. Ammonia becomes the foundation for nitrogen fertilizers including urea. Nitrogen fertilizer feeds crop yields.
According to the IEA’s Global Hydrogen Review 2026, the Middle East accounts for roughly one-sixth of global hydrogen production, more than one-quarter of global ammonia trade, almost 40% of urea trade and almost 45% of methanol trade.[9]
Chart 5. From Hormuz to the Dinner Table
Middle East share of global trade in selected hydrogen-based products.
Source: ryo.news visualization using IEA Global Hydrogen Review 2026.[9]
As the 2026 conflict disrupted energy and chemical supply chains, urea prices roughly doubled between January and May. The IEA documented fertilizer-production impacts extending beyond the Gulf into import-dependent economies, while the UN Food and Agriculture Organization warned that fertilizer scarcity could affect subsequent harvests and food availability.[9][10]
The transmission mechanism is international. One-quarter of ammonia production in Bangladesh, India and Pakistan uses natural gas imported from the Middle East. Morocco imports all of its ammonia demand, with roughly 40% sourced from the region. Brazil, Australia, South Africa and Thailand import all of their urea demand, with Middle Eastern supply accounting for large shares of those imports.[9]
The World Bank likewise recorded a major fertilizer-price shock during the crisis.[11]
Hormuz → natural gas → hydrogen → ammonia → urea → fertilizer → crop yields → food prices → political stability
That is how a naval crisis becomes a grocery bill.
And it introduces a phenomenon that may define the next macroeconomic phase: stagflationary bifurcation.
A supply shock does not necessarily make every asset rise together. It can make necessities more expensive while simultaneously weakening the financial assets used to fund their consumption.
Energy, transportation, fertilizer and food can rise because they are physically scarce. Corporate margins can fall because inputs are more expensive. Consumers can reduce discretionary spending because essentials absorb more income. Inflation can limit the ability of central banks to ease. Higher real or nominal discount rates can then pressure the valuation of financial assets.
What if the next crisis makes everything you need more expensive while making everything you leveraged yourself to own less valuable?
That outcome is not guaranteed. But unlike the simplistic claim that “everything inflates” or “everything crashes,” it describes the actual transmission mechanism of a supply shock through an indebted economy.
V. Destruction Is Not Control
The second video that informs this analysis comes from University of Chicago political scientist Robert Pape, whose academic work has focused on coercion, air power, international security and political violence.[5][6]
Pape’s argument is valuable because it challenges the most seductive metric in modern warfare: the target list.
How many launchers were destroyed?
How many facilities were hit?
How many commanders were killed?
Those questions measure destruction. They do not automatically measure political control.
Pape’s earlier work on coercive air power examined the conditions under which military punishment or denial can actually force an opponent to change behaviour.[7] His 2026 assessment applies the same logic to Iran: a state can suffer enormous military damage and still possess strategic leverage if it controls—or can credibly threaten—a resource its opponents cannot easily replace.[5]
Hormuz converts geography into bargaining power.
The important question is not: Who destroyed more? It is: Who still controls the constraint?
This is a principle that reaches far beyond warfare.
A government does not need to confiscate every citizen’s wealth if it controls the bank accounts through which that wealth moves.
A company does not need to own an entire payment network if it can deny access at a critical gateway.
A token issuer does not need to control the blockchain if it retains decisive authority over issuance or redemption.
A digital platform does not need to own your identity if access to the network requires its approval.
Power accumulates wherever a broad system narrows into a small number of indispensable decisions.
VI. The Commercial Veto
This leads to one of the most important lessons of the 2026 crisis.
A state can announce that a maritime route is open.
That does not make the route economically open.
The International Maritime Organization stated on June 9 that reliable security assurances were still absent and that safe passage through Hormuz could not simply be assumed. Crucially, it emphasized that the ship’s master and company remained responsible for voyage planning and risk assessment.[3]
By June 15, the IMO had verified at least 46 attacks on international shipping in and around the conflict zone since February 28.[4]
A tanker therefore requires more than naval permission.
The owner must accept the risk.
The crew must be willing to transit.
The insurer must price the voyage.
The cargo owner must tolerate the exposure.
The financing institutions must remain willing to fund it.
This is the Commercial Veto:
A corridor is not open because the sovereign says it is open. It is open when the institutions required to use it believe it is open.
The same distinction appears in digital money.
A protocol can be technically permissionless while its economic access layer becomes increasingly permissioned. Exchanges can delist it. Banks can refuse counterparties. Custodians can decline support. Liquidity can concentrate in a few venues. Infrastructure can become centralized. Regulatory rules can transform a theoretical right to transact into a practical inability to enter or exit the network.
Protocol freedom and commercial freedom are related.
They are not identical.
VII. Asymmetric Warfare Becomes Asymmetric Economics
The logic of missiles and interceptors offers another general lesson.
An attacker does not always need to defeat the defender outright. It may be enough to force the defender to purchase safety at an increasingly unfavourable exchange rate.
Low-cost drones, missiles and distributed launch systems can impose expensive requirements for interception, surveillance, patrols, hardened infrastructure and continuous readiness. Pape’s discussion is more nuanced than the simplistic claim that the United States is “running out of bombs.” His concern centres on particular categories of defensive capability, stockpiles and the strategic consequences of reallocating finite systems between theatres.[5]
This is asymmetric economics.
The aggressor spends one unit.
The defender must spend ten to prevent the one unit from mattering.
The same asymmetry increasingly defines cybersecurity. A relatively small group can force banks, governments and industrial networks to maintain vast defensive infrastructures because one successful intrusion can impose costs many orders of magnitude larger than the attack itself.
That is the broader argument developed in Cyberwarfare, Financial Infrastructure, and the Rise of Neutral Money: modern financial infrastructure is not merely a neutral conduit for economic activity. In conflict, the conduit becomes terrain.
Hormuz demonstrates the physical version.
Cyberwarfare demonstrates the digital version.
Money connects them.
VIII. Short Political Time, Long Geopolitical Time
Pape also identifies an escalation problem that markets often underestimate.
Political leaders do not always optimize for the long-term strategic outcome.
They may optimize for surviving the next week, budget vote, election, coalition crisis or public humiliation.
A strategy can become more expensive and less promising while simultaneously becoming harder to abandon. Once prestige, credibility and domestic political ownership attach to a conflict, admitting failure can impose an immediate political cost larger than the expected future cost of continuing it.[5]
Pape invokes the logic of historical escalation to explain why leaders can continue strategies whose long-term prospects are deteriorating. The analogy should not be abused. Iran in 2026 is not Vietnam in the 1960s. The valuable comparison is not between the wars themselves but between the political incentives that can make retrenchment more difficult than escalation.
His related academic work on occupation and suicide terrorism adds another possible tail risk, although that literature is contested and has been challenged on methodological grounds.[42][43] The responsible conclusion is therefore not that one specific attack or escalation is inevitable. It is that military operations can produce second-order political and security effects that simple battlefield scorecards do not capture.
IX. Strategic Reserves Buy Time, Not Independence
Governments maintain strategic reserves because chokepoints are known to exist.
The United States Strategic Petroleum Reserve is one of the largest examples of institutionalized redundancy.
On April 3, 2026, the SPR held approximately 413.3 million barrels of crude oil. By August 7, it held about 298.7 million barrels—a decline of approximately 114.6 million barrels, or 27.7%, in just over four months.[12]
Chart 6. Reserves Buy Time. They Do Not Reopen Straits.
U.S. Strategic Petroleum Reserve, selected weekly observations, million barrels.
Source: ryo.news visualization using weekly U.S. Energy Information Administration data.[12]
That drawdown is strategically significant.
It does not mean the United States was weeks away from “running out of oil.”
The country continued producing roughly 13.8 million barrels of crude per day in August and maintained large commercial petroleum inventories in addition to the SPR.[13]
The distinction matters because a strategic reserve is not a substitute for the energy system. It is a buffer against disruption to that system. The faster a buffer is consumed, the less flexibility remains if the original problem persists or a second crisis appears elsewhere.
Reserves buy time. They do not recreate the missing corridor.
A reserve is a temporal bypass.
A pipeline is a geographic bypass.
An alternative supplier is a commercial bypass.
None abolishes dependence. They redistribute it.
This matters when we reach monetary systems, because reserve currencies are themselves a form of strategic redundancy. Gold, foreign exchange, credit lines and alternative payment rails are not merely assets. They are attempts to ensure that a state can continue operating if one financial corridor closes.
X. The Shock Arrives Before the Balance Sheet Heals
The physical shock of 2026 did not arrive in a financially neutral world.
It arrived after years of extraordinary sovereign borrowing, elevated asset valuations and political dependence on inexpensive financing.
This is where Maloney’s financial argument becomes useful, but only after removing the superlatives.
We do not need to claim that every stock market and every property market is simultaneously experiencing “the largest bubble in history.”
We can say something more defensible.
U.S. equity valuations remain historically elevated by long-run measures such as Robert Shiller’s cyclically adjusted price-to-earnings ratio, whose underlying dataset reaches back to 1871.[15]
Chart 7. U.S. Equity Valuations in Historical Context
Selected observations from the Shiller CAPE series. Higher values indicate investors are paying more relative to ten-year inflation-adjusted earnings.
Source: ryo.news visualization based on Robert Shiller’s historical U.S. market dataset. The point is historical valuation context, not a short-term market forecast.[15]
The comparison is striking precisely because it does not require us to call the present market the largest bubble ever. A CAPE reading above 40 places U.S. equities in a historically rare valuation regime, close to the extreme reached around the dot-com peak and materially above the level reached immediately before the 1929 crash.
That does not tell us when prices will fall. Valuation is not a clock. Markets can remain expensive for years, earnings can grow into valuations, and structural changes can alter the level investors are willing to pay.
What it does tell us is that a major supply shock is not arriving against obviously cheap financial assets.
Housing requires the same discipline.
Dallas Federal Reserve research published in May 2026 found that pandemic-era housing overvaluation had corrected substantially in several overseas markets while U.S. price-to-rent valuations remained materially above a fundamentals-implied benchmark.[16]
Chart 8. U.S. Housing Remains Above Its Fundamentals-Based Benchmark
Dallas Fed comparison of observed price-to-rent ratios with fundamentals-based estimates.
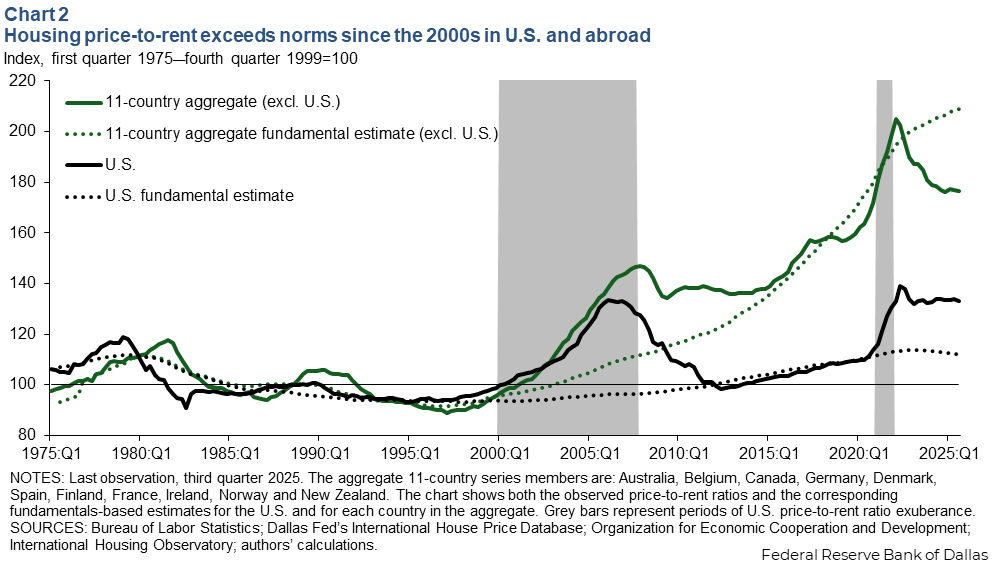
Source: Federal Reserve Bank of Dallas, May 2026.[16]
The chart tells a more interesting story than “global property bubble.” The higher-risk foreign aggregate surged much further during the pandemic but subsequently corrected toward or below its model-implied value. The United States rose less dramatically, but it also adjusted less. By late 2025, the observed U.S. price-to-rent ratio remained well above the fundamentals-based estimate.
There is also an important difference from 2008. The Dallas Fed notes that household leverage and aggregate loan-to-value ratios are lower than during the pre-financial-crisis period. Over 2020–25, mortgage debt relative to income averaged about 2.5 compared with 3.6 during 2007–12, while aggregate loan-to-value ratios were also lower.[16]
That makes “2008 again” a poor analytical shortcut.
The vulnerability lies less in an identical mortgage-credit structure than in the interaction between expensive housing, strained affordability, slower future price growth and household consumption.
Above both asset markets sits the sovereign balance sheet.
The IMF’s April 2026 Fiscal Monitor estimated global gross government debt at nearly 94% of GDP in 2025. On current trajectories, the Fund expects the global ratio to reach 100% by 2029 and approximately 102% by 2031.[14]
Chart 9. The Shock Arrives Before the Balance Sheet Heals
Global gross government debt as a share of global GDP.
Source: ryo.news visualization using IMF Fiscal Monitor, April 2026. 2029 and 2031 values are IMF projections.[14]
The IMF’s warning is not simply that debt is high. It is that the fiscal margin around that debt is narrowing. Higher interest costs, persistent primary deficits and greater market sensitivity to fiscal news make the next shock more expensive to absorb. The Middle East conflict adds pressure because governments face demands to subsidize energy, protect consumers, fund defence and preserve economic activity at the same time that borrowing is becoming more consequential.[14]
That distinction matters.
Vulnerability is not inevitability.
High valuation is not a timing signal.
Debt does not prove imminent collapse.
But expensive financial claims, constrained fiscal capacity and a renewed commodity shock form an uncomfortable combination.
In The End of Free-Floating Fiat, we argued that geopolitical fragmentation was beginning to collide with the assumptions underlying the post-1971 monetary system. The better formulation today is more precise:
The problem is not that fiat has already ended. The problem is that highly indebted sovereign balance sheets are being asked to absorb shocks that make monetary compromise more difficult.
Cut rates too aggressively and inflationary pressure may worsen.
Keep policy tight and indebted governments, companies and households pay more to refinance.
Subsidize energy and the fiscal deficit expands.
Allow the full price shock through and political pressure rises.
The chokepoint migrates from the Strait into the balance sheet.
XI. Gold Is Neutral at Rest
When trust in financial promises declines, investors and states often return to assets that are not someone else’s liability.
That is gold’s geopolitical advantage.
A dollar deposit is a liability of a bank.
A Treasury security is a liability of the U.S. government.
A fiat-backed stablecoin is ultimately dependent on an issuer and a reserve structure.
Physical gold held directly is no institution’s promise to pay.
The scale of central-bank accumulation since 2022 illustrates that distinction. World Gold Council estimates place official-sector net buying at roughly 1,082 tonnes in 2022, 1,037 tonnes in 2023 and more than 1,000 tonnes again in 2024. Purchases remained elevated at 863 tonnes in 2025.[17]
But 2026 adds useful nuance. The World Gold Council revised first-quarter central-bank demand sharply lower to about 57 tonnes before estimating a rebound to approximately 289 tonnes in Q2. First-half demand therefore totalled roughly 345 tonnes, the weakest first half since 2022 while still representing substantial net official-sector accumulation.[17]
Chart 10. Central Banks Are Still Buying Monetary Neutrality
Estimated central-bank net gold demand, tonnes. H1 2026 is a half-year figure and is shown separately from full-year totals.
*2024 was subsequently revised upward from the initially published estimate. H1 2026 comprises a revised Q1 estimate of roughly 57t and approximately 289t in Q2.
Source: ryo.news visualization using World Gold Council / Metals Focus estimates.[17]
The long-term story is therefore stronger than the quarterly headline.
States continue to value assets that reduce counterparty and issuer risk, but they also use those reserves dynamically. A central bank may accumulate gold for years and then sell during a crisis. That is not a contradiction. It is one reason a reserve exists.
Gold’s significance is not that its price must always rise during geopolitical disorder. It is that possession does not depend on another state honouring a liability.
Silver occupies a different position. It combines monetary history with heavy industrial use. The Silver Institute estimates that 2025 produced the fifth consecutive annual market deficit, at roughly 40.3 million ounces, and forecasts another deficit of about 46.3 million ounces in 2026.[18]
Chart 11. Silver’s Consecutive Market Deficits
Annual silver market deficit, million ounces. Larger bars indicate a larger shortfall between total supply and total demand.
2026F = forecast. A smaller annual deficit does not mean physical tightness disappears; cumulative deficits draw on above-ground inventories.
Source: ryo.news visualization using Metals Focus data published in the Silver Institute’s World Silver Survey 2026.[18]
The pattern is instructive because it prevents another simplification. A structural deficit does not guarantee an immediate price explosion. Mine production, recycling, inventories, investment demand, industrial thrift and substitution all interact.
But consecutive deficits tell us that physical industrial commodities can remain constrained even as monetary demand competes with technological demand. The modern monetary problem is therefore not detached from the material economy. It is embedded inside it.
Gold, however, exposes a limitation that becomes increasingly important in a digital economy.
Gold is neutral at rest. The harder question is neutrality in motion.
Gold is excellent at removing issuer risk.
It is less efficient when two economic actors on opposite sides of the planet need to settle privately, rapidly and natively across a digital network.
That is where the argument moves from neutral reserves to neutral settlement.
XII. The Monetary Strait
If Hormuz is a corridor through which energy must pass, what are the corridors through which money must pass?
For conventional fiat, the route may involve a depositor, a commercial bank, correspondent institutions, clearing networks, central-bank money and regulatory jurisdictions.
For a fiat-backed stablecoin, the blockchain may remove some intermediaries from transfer while leaving another dependency intact: the issuer, the reserve assets, banking relationships and redemption architecture.
For a CBDC, the precise path depends on its design, but the monetary unit remains a sovereign liability administered inside an institutional framework.
For Bitcoin and other permissionless cryptocurrencies, the issuer disappears, but new dependencies appear: public network visibility, miners or validators, exchanges, custody, software implementations, liquidity and governance.
This is the Monetary Strait. Every form of money has a route. Every route has points at which control can concentrate.
And a chokepoint does not stop being a chokepoint because its coordinates are written in code.
This extends the Sovereignty–Neutrality Frontier developed in Private From Washington, Visible to Beijing.
A monetary system can become extremely useful to its administrator when that administrator retains privileged powers over identity, issuance, compliance or transaction approval.
But those same privileges can make the system less neutral to outsiders.
The tension is structural.
The more power one participant possesses inside the money, the more every other participant must trust that power will not be used against them.
XIII. Stablecoins: A Bypass With an Owner
Stablecoins demonstrate why monetary sovereignty is not binary.
They have genuine advantages.
A dollar-denominated token can move globally around the clock, reduce dependence on certain domestic banking rails and provide access to dollar-like units in countries where banking systems are weak, expensive or restricted.
This is why our earlier analysis in Bolivia, USDT and the Battle for Monetary Sovereignty treated stablecoins seriously rather than dismissing them as merely speculative crypto instruments.
But stablecoins solve one dependency by introducing another.
The Bank for International Settlements recognizes the potential of tokenized money for faster and more programmable payments while arguing that current stablecoin structures introduce concerns around monetary integrity, stability and the foundational properties expected of money.[19] The Financial Stability Board’s global stablecoin framework likewise focuses on governance, reserve assets, redemption, risk management and the legal entities responsible for the arrangement.[20]
A stablecoin can route around a bank. It cannot route around its issuer.
The blockchain may be decentralized.
The monetary liability does not necessarily become decentralized with it.
This does not make stablecoins useless. It makes their sovereignty characteristics different from bearer assets and issuerless cryptocurrencies.
The Financial Action Task Force’s 2026 update adds another layer. FATF continues to push implementation of licensing, supervision and Travel Rule requirements while focusing increasingly on stablecoins, unhosted wallets, offshore service providers and peer-to-peer crypto activity.[21]
The result is an important distinction between the protocol and its access perimeter.
A token can move on-chain while regulators construct chokepoints around the institutions that convert it, custody it, redeem it or connect it to the conventional economy.
The Commercial Veto has a monetary equivalent.
XIV. CBDCs: The Chokepoint Becomes Software
Central bank digital currencies require more precision than much of the cryptocurrency industry gives them.
Our earlier Velocity, Control, and the Coming Clash focused heavily on the theoretical capacity of programmable sovereign money to enforce policy at the transaction layer.
That capacity should not be confused with a universal description of every CBDC design.
The European Central Bank’s proposed digital euro, for example, explicitly includes privacy objectives. The ECB says offline payments are intended to provide cash-like privacy and that the Eurosystem should not be able to directly associate ordinary online payment data with an identified individual in the simplistic manner often implied by critics.[22]
That counterexample matters.
The strongest criticism of CBDCs is therefore not that every central bank will inevitably implement maximum surveillance or expiry dates.
It is that a centrally administered digital monetary system can, depending on its architecture and law, make policy conditions technically enforceable at the monetary layer.
Cash creates physical limits on control.
Software can move those limits.
A CBDC does not necessarily create a dystopia. But it can place the customs office inside the currency.
The relevant questions are architectural:
- Who sees transaction data?
- Who can change the rules?
- Can funds be restricted?
- Can identity be separated from settlement?
- Can users transact offline?
- Can policy be applied selectively?
- What remains possible if the political assumptions behind today’s privacy guarantees change tomorrow?
The problem is not technology in isolation.
It is privileged control.
XV. The Monetary Chokepoint Test
Instead of dividing money into crude categories such as “centralized” and “decentralized,” we can ask where the actual chokepoints reside.
| Question | Why it matters |
|---|---|
| 1. Issuer neutrality | Can one institution create, freeze, cancel or selectively impair monetary units? |
| 2. Fungibility | Can transaction history make one unit economically different from another? |
| 3. Ledger privacy | What can observers infer about counterparties, balances and amounts? |
| 4. Network privacy | Can observers connect a transaction to an originating device, IP address or location? |
| 5. Selective disclosure | Can a user prove a legitimate fact without publishing their entire financial history? |
| 6. Consensus distribution | Who actually produces, validates or finalizes the monetary history? |
| 7. Infrastructure decentralization | How dependent is the system on a small number of relays, pools, RPC providers, custodians or interfaces? |
| 8. Governance independence | Who can change the protocol, and how concentrated is that authority? |
| 9. Access and liquidity | Can the asset actually be acquired, transferred and exchanged at meaningful scale? |
| 10. Implementation quality | Have security claims survived specification, code review, testing, audits and adversarial use? |
No major monetary system scores perfectly across all ten.
Gold has extraordinary issuer neutrality and bearer properties but weak native digital portability.
Fiat offers deep liquidity and institutional acceptance but depends on sovereign and banking infrastructure.
Stablecoins combine blockchain transport with issuer-dependent monetary claims.
Bitcoin removes the issuer while preserving a transparent global ledger.
Privacy coins attempt to remove or reduce the observation layer as well.
But that final category creates its own challenge.
Privacy is not one feature.
It is another stack.
XVI. Privacy Can Fail Between Layers
A cryptocurrency can have sophisticated transaction cryptography and still leak identity somewhere else.
This is one of the central conclusions of our recent ProxyMark and Monero over Tor analysis.
Ledger privacy, wallet behaviour, peer-to-peer forwarding and network transport are separate layers. An observer who cannot determine which output was spent may still attempt to infer where the transaction originated. An exchange may possess identity information unavailable to an ordinary blockchain observer. A compromised wallet may defeat cryptography by exposing secrets before a transaction is ever broadcast.
Low-latency anonymity systems such as Tor were built around a particular balance between usability and anonymity. The foundational Tor design itself discusses the difficulty of resisting powerful end-to-end traffic analysis while preserving low latency.[26]
Mix-network research such as Loopix explores a different trade-off: deliberate delays, mixing and cover traffic can make traffic correlation harder at the cost of immediacy.[25]
- A mixnet is not “perfect anonymity.”
- Tor is not “broken” because a stronger threat model exists.
- Zero-knowledge proofs do not hide IP addresses.
- Encryption does not create liquidity.
- Decentralized consensus does not guarantee decentralized governance.
This is the more mature privacy standard articulated in The End of the Ring:
Ask what information each layer forces the participant to reveal. Then ask again at the next layer.
The global economy is a chokepoint stack.
A private monetary system therefore requires defence in depth.
XVII. Ryo: Current Architecture and Roadmap
Ryo Currency enters this argument not as a magical escape from every dependency, but as one attempt to design monetary infrastructure around the problem.
The distinction between current and planned architecture is essential.
| Layer | Status | Ryo approach |
|---|---|---|
| Transaction privacy | Current | CryptoNote/RingCT lineage with default private transactions and a default ring size of 25.[28] |
| Recipient privacy | Current | Stealth-address architecture inherited from the CryptoNote model.[28] |
| Amount privacy | Current | Ring Confidential Transaction mechanisms conceal transferred values at the ledger layer.[28] |
| Selective proofs | Current | Wallet tooling includes transaction and reserve proof functionality, allowing specific facts to be demonstrated without turning all activity into a transparent account.[30] |
| Distribution / consensus | Current | GPU-oriented Proof-of-Work heritage intended to broaden participation beyond specialized ASIC infrastructure. |
| Zero-knowledge transaction architecture | Planned | A separate Halo 2-based Ryo privacy architecture intended to replace the fixed-ring model.[28][29] |
| Network metadata privacy | Planned | High-latency mixnet intended to address traffic-analysis risks beyond the blockchain layer.[27][29] |
| Consensus transition | Planned | Transition toward Proof-of-Stake.[28] |
| Governance | Planned | DAO-oriented governance architecture within the broader roadmap.[28] |
The distinction is not cosmetic.
Halo 2 is not itself a privacy protocol. It is a proving framework derived from research into recursive zero-knowledge proof systems without a trusted setup.[23] Protocol designers must define the circuits and state transitions that the proof system will enforce.[24]
A proof can be mathematically valid relative to a flawed specification.
A mixnet can be conceptually strong while an implementation contains metadata leaks.
A Proof-of-Stake network can be decentralized in theory while stake becomes concentrated in practice.
A DAO can distribute governance or merely formalize the power of the largest holders.
This is why the correct standard for Ryo’s roadmap is neither promotion nor dismissal. It is verification.
XVIII. The Chokepoints Ryo Has Not Solved
If the thesis of this article is that every system contains chokepoints, it would be intellectually dishonest to present Ryo as an exception.
Ryo has them too.
Its liquidity remains far below Bitcoin and the largest cryptocurrency networks. Exchange access is limited. Its wallet and infrastructure ecosystem is smaller. Development capacity is finite. Future Halo 2 circuits will require independent scrutiny. A high-latency mixnet will require real-world performance testing against clearly defined adversaries. A Proof-of-Stake transition will raise questions about validator concentration and stake distribution. DAO governance will need to demonstrate that political authority does not simply migrate to a small group of economically dominant actors.
Regulation is another chokepoint.
A protocol may remain operational while licensed institutions are prohibited from offering services around it. Privacy-preserving cryptocurrencies therefore face a paradox: the characteristics that make them more neutral at the protocol layer can make them more difficult to integrate into regulated financial infrastructure.
Then there is adoption.
Cryptography cannot manufacture economic gravity.
As argued in The Bitcoin Magnet, Bitcoin’s power does not come only from its issuance rules. It comes from the enormous network of capital, miners, developers, businesses, custody, liquidity and cultural legitimacy that accumulated around those rules.
Ryo does not yet possess comparable liquidity, recognition or institutional depth.
That limitation is decisive.
It is also analytically useful, because it prevents the conclusion from becoming propaganda.
The point is not that Ryo has no chokepoints. The point is that a sovereignty-oriented monetary system should be designed to discover them, distribute them and, wherever possible, remove them.
XIX. From Network Money to Network Sovereignty
This is where the discussion reconnects with the broader network-state thesis developed across When Institutions Fail, God, State, and Network and From Network Union to Network State.
A digital community cannot become economically sovereign simply because it has a chat server, a token and a governance interface.
It requires an identity layer.
It requires capital.
It requires settlement.
It requires institutions.
It requires infrastructure.
It requires a method of collective decision-making.
And if it expects to survive serious political pressure, it requires redundancy.
Do not build a civilization whose essential functions all pass through one gatekeeper.
That principle applies to energy.
It applies to communication.
It applies to cloud infrastructure.
It applies to identity.
And it applies to money.
A network state whose treasury can be frozen by a foreign issuer is not monetarily sovereign.
A digital polity whose entire transaction graph is visible to every external intelligence service is not informationally sovereign.
A community whose settlement asset depends on one exchange is not economically sovereign.
A DAO controlled by a handful of large holders is not politically sovereign simply because its votes occur on-chain.
Sovereignty is not a label.
It is the progressive removal of dependencies that another actor can convert into unilateral power.
XX. Every System Has a Strait
The Strait of Hormuz is frightening because it makes dependence visible.
A narrow stretch of water appears on the map. Tankers queue. Insurance premiums rise. Oil prices move. Everyone can see the constraint.
Most chokepoints are harder to see.
Helium disappears into fabrication processes and cryogenic systems.
Natural gas disappears into fertilizer.
Fertilizer disappears into food.
Interceptors disappear into strategic stockpiles.
Debt disappears into government balance sheets.
Correspondent banks disappear behind an international transfer.
Identity systems disappear behind a payment application.
Metadata disappears into network logs.
Until the day the corridor closes.
Then the hidden architecture becomes political.
This is the lesson connecting Maloney’s material-economy warning and Pape’s analysis of coercive leverage.
The world is not becoming less interconnected.
It is discovering that interconnection without redundancy creates leverage.
Gold answers one part of that problem by removing issuer risk.
Bitcoin answers another by demonstrating that digital scarcity and settlement can exist without a sovereign issuer.
Stablecoins answer another by making fiat-denominated units more portable across digital networks, while retaining issuer and reserve dependencies.
CBDCs may make sovereign money more efficient and digitally native, while raising architecture-dependent questions about institutional visibility and control.
Privacy coins ask a different question:
Can digital money remove not only the privileged issuer, but also the privileged observer?
Ryo belongs in that argument because it is attempting to treat privacy as more than an encrypted transaction field. Its current architecture already seeks default transaction privacy. Its roadmap extends the problem toward zero-knowledge proofs, network metadata, consensus and governance.
Whether that architecture succeeds will not be decided by a roadmap graphic.
It will be decided in code.
In audits.
In adversarial testing.
In decentralization.
In liquidity.
In infrastructure.
In governance.
And eventually, in whether people actually choose to use it.
That uncertainty does not weaken the thesis.
It completes it.
Oil needs a strait.
Helium needs a supply chain.
Fertilizer needs gas.
AI needs chips.
Governments need financing.
Fiat needs institutions.
Stablecoins need issuers.
CBDCs need administrators.
Cryptocurrencies need protocols, networks and communities.
Every system has dependencies.
The defining political question is whether those dependencies can be transformed into instruments of control.
Privacy coins represent an attempt to design digital money differently: not money without rules, geography, risk or institutions, but money with fewer privileged positions from which one actor can observe, discriminate or deny.
Ryo is one experiment in that architecture.
It should be judged neither by the promises of its roadmap nor by the assumptions of its critics, but by the chokepoints it actually removes and the new ones it creates.
Hormuz has made the problem impossible to ignore.
Every system has a strait.
Sovereignty begins by knowing which one you depend on—and whether you can route around it.
Further Reading from ryo.news
- Cyberwarfare, Financial Infrastructure, and the Rise of Neutral Money — How financial infrastructure becomes strategic terrain during geopolitical conflict.
- The Post-Fiat Renaissance — The original neutral-money framework for a fragmenting monetary order.
- The Yuan Ultimatum — The first ryo.news examination of Hormuz as a monetary rather than merely energy chokepoint.
- The End of Free-Floating Fiat — How commodity security and monetary architecture interact under geopolitical stress.
- The Human Chokepoint — The individual as the final endpoint of monetary and institutional exclusion.
- When Institutions Fail — Alternative networks, economic redundancy and institutional failure.
- God, State, and Network — Money as governance infrastructure in the age of network power.
- From Network Union to Network State — How capital, coordination and private settlement fit into emerging digital polities.
- Private From Washington, Visible to Beijing — The Sovereignty–Neutrality Frontier and the contradiction between geopolitical independence and domestic monetary control.
- The Bitcoin Magnet — Why protocol design alone does not create sovereign economic gravity.
- ProxyMark and Monero over Tor — Why ledger, wallet, P2P and transport privacy must be evaluated separately.
- The End of the Ring — The transition from transaction privacy toward a complete privacy-sovereignty stack.
References
- International Energy Agency, “Strait of Hormuz,” updated 2026.
- U.S. Energy Information Administration, Short-Term Energy Outlook: Global Energy Security and Chokepoint Analysis, August 2026.
- International Maritime Organization, “No Safe Passage in the Strait of Hormuz,” June 9, 2026.
- International Maritime Organization, statement on the U.S.–Iran agreement and attacks on international shipping, June 15, 2026.
- Robert Pape interview, The Diary of a CEO, 2026. Used for Pape’s contemporary strategic assessment and interpretation, not as the authority for independently verifiable economic data.
- University of Chicago Department of Political Science, Robert A. Pape faculty profile.
- Robert A. Pape, Bombing to Win: Air Power and Coercion in War, Cornell University Press, 1996.
- U.S. Geological Survey, Mineral Commodity Summaries 2026, Helium and Rare Gases.
- International Energy Agency, Global Hydrogen Review 2026, Executive Summary.
- Food and Agriculture Organization of the United Nations, Global Agrifood Implications of the 2026 Conflict in the Middle East.
- World Bank, Commodity Markets Outlook, April 2026.
- U.S. Energy Information Administration, Weekly U.S. Ending Stocks of Crude Oil in the Strategic Petroleum Reserve.
- U.S. Energy Information Administration, Weekly U.S. Petroleum Supply Estimates.
- International Monetary Fund, Fiscal Monitor: Fiscal Policy under Pressure—High Debt, Rising Risks, April 2026.
- Robert J. Shiller, Yale University, U.S. Stock Markets 1871–Present historical dataset.
- Enrique Martínez García and Efthymios Pavlidis, “U.S. housing: Unaffordable to buy, but wealth-building to own,” Federal Reserve Bank of Dallas, May 19, 2026.
- World Gold Council, Gold Demand Trends Q2 2026: Central Banks, including revised Q1 2026 estimates.
- The Silver Institute / Metals Focus, World Silver Survey 2026.
- Bank for International Settlements, Annual Economic Report 2026, Chapter III: “Anchoring Trust in Money: Innovation Beyond Stablecoins.”
- Financial Stability Board, High-Level Recommendations for the Regulation, Supervision and Oversight of Global Stablecoin Arrangements.
- Financial Action Task Force, 2026 Targeted Update on Virtual Assets and Virtual Asset Service Providers.
- European Central Bank, “Digital Euro and Privacy.”
- Sean Bowe, Jack Grigg and Daira Hopwood, “Halo: Recursive Proof Composition without a Trusted Setup,” IACR Cryptology ePrint Archive, 2019.
- The Halo 2 Book, technical documentation.
- Ania M. Piotrowska et al., “The Loopix Anonymity System,” USENIX Security Symposium, 2017.
- Roger Dingledine, Nick Mathewson and Paul Syverson, “Tor: The Second-Generation Onion Router,” USENIX Security Symposium, 2004.
- Privacy Coin Report, “ProxyMark and Monero over Tor: How Privacy Can Fail Between Layers,” ryo.news, August 2026.
- Privacy Coin Report, “The End of the Ring: Privacy Coins and the Architecture of Digital Sovereignty,” ryo.news, August 2026.
- ryo.news, Ryo Currency technology and roadmap overview.
- Ryo Currency, Wallet RPC API Reference.
- k1ngVV, “Private From Washington, Visible to Beijing: China, Privacy Coins and Financial Sovereignty,” ryo.news, July 2026.
- k1ngVV, “The Bitcoin Magnet: How Network Assets Create Economic Gravity,” ryo.news, August 2026.
- k1ngVV, “The Human Chokepoint,” ryo.news, March 2026.
- k1ngVV, “The End of Free-Floating Fiat,” ryo.news, March 2026.
- k1ngVV, “The Yuan Ultimatum,” ryo.news, March 2026.
- k1ngVV, “The Post-Fiat Renaissance,” ryo.news, March 2026.
- k1ngVV, “When Institutions Fail,” ryo.news, March 2026.
- k1ngVV, “From Network Union to Network State,” ryo.news, March 2026.
- k1ngVV, “Autonomous AI Agents Need Private Money: The Infrastructure of Machine Economies,” ryo.news, February 2026.
- k1ngVV, “Velocity, Control, and the Coming Clash: CBDCs vs. Privacy Coins and the Future of Economic Freedom,” ryo.news, December 2025.
- Mike Maloney, “This Is It: Mike Maloney’s Most Important Video Ever – Helium, Oil, Gold, Silver & the Iran Crisis,” 2026. Used as a source of hypotheses and dependency-chain concepts; material numerical claims in this article are independently sourced above.
- Robert A. Pape, “The Strategic Logic of Suicide Terrorism,” American Political Science Review, 2003.
- Scott Ashworth, Joshua D. Clinton, Adam Meirowitz and Kristopher W. Ramsay, “Design, Inference, and the Strategic Logic of Suicide Terrorism,” American Political Science Review, 2008.
Editorial Note: This article is geopolitical, economic and technological analysis, not investment advice. Statements concerning future Ryo Currency features—including Halo 2, the high-latency mixnet, Proof-of-Stake and DAO-oriented governance—refer to published roadmap objectives and should not be interpreted as capabilities already deployed on mainnet. Security and privacy claims depend on the final protocol specification, implementation, review, testing, network configuration and real-world threat model.